
AI Enabled CFO Dashboard in Power BI
About This Course
📘 Course Overview
This online program is a hands-on training designed for Business and Finance Professionals who want to automate financial reporting and perform deeper financial analysis using Power BI and Artificial Intelligence (AI).
The course is based on a practical case study that reflects real challenges faced by finance teams during the preparation of financial reports.
Participants will learn how to transform raw financial data into executive-level dashboards, automate financial reporting processes, and generate meaningful insights for management.
Using Power BI, Power Query, DAX, and AI-assisted analytics, you will discover clear and practical techniques to significantly reduce manual work and enhance financial analysis.
- learn how to use Artificial Intelligence together with Power BI to accelerate analytics.
- Use Power Query, and Power BI to automate the preparation of financial statements and business reporting;
- Learn Two Powerful Languages of Power BI “M-Language” and “DAX Language” to stand ahead of the crowd.
- Learn the most relevant skills like Data Wrangling, Data Modeling, and Data Analytics required by Business and Finance Professionals;
- Explore the power of Data Analysis Expression DAXto unlock Data Analytics in Business and Financial Analysis
- Save time from non-value-adding routine tasks and channel the time saved to perform more value-adding analysis tasks;
- Impress your bosses with timely and highly accurate reports.
Learning Objectives
Material Includes
- 🎁 What You’ll Get When You Join This Course
- ✅ CFO Dashboard Template Pack (Board-Ready)
- ✅ Fully Structured Financial Datasets
- ✅ AI-Enabled Development Assets
- ✅ Trainer’s Complete Power BI Files (PBIX)
- ✅ Session Recordings (Lifetime Learning Access)
- ✅ Exclusive Bonus – Udemy Course Access
Requirements
- Trusted by 2,500+ Finance Professionals from 40+ Countries to Master Power BI for Board Reporting Recognized by CFOs and Finance Leaders from global organizations like Allied Bank, Meezan Bank, Suzuki, and Tabuk Pharmaceuticals
Target Audience
- This program is designed for forward-thinking professionals who aim to elevate their financial decision-making using data analytics and Power BI:
- 🔹 Top Management
- Ideal for senior finance and business leaders responsible for driving strategic performance, including CFOs, CIAs, Finance Business Partners, Directors/Heads of Finance, Financial Controllers, Business Controllers, and other senior finance professionals.
- 🔹 Middle Management
- Designed for mid-level finance and business professionals who want to grow into analytics champions, including Finance Managers, Business Analysts, Financial Analysts, Assistant Managers, and other emerging finance leaders.
- 🔹 Others
- Open to aspiring learners and business-minded professionals who want to use Power BI for smarter decisions, including Finance & Accounting Students, Consultants, Freelancers, Business Owners, Entrepreneurs, and Start-up Founders.
Curriculum
Topic 01 – Understanding Power BI Basics for Financial Reporting (Monthly Trail Balance):
Objective
Understand how Power BI works and prepare a clean Trial Balance for reporting.
-
Building Block of Business Reporting in Power BI
- Existing Vs Improved Method
- Normal Data Cleaning Vs Power Query
-
Dataset Concepts for Excel Users
- 4 Data Transformation Concepts
- 2 Table Collaboration Concepts
-
Types of Tables in the Data-Base
- Lookup Tables and why they are used
- Data Tables and why they are used
-
Preparing a Monthly Trial Balance
- Reshaping data where needed, such as converting columns into rows for reporting
- Assigning correct data types, including text, numbers, and dates
- Understand the Syntax of DAX
-
Concept of DAX
- Object, Operators and Their Types
- Measures, Filters, Variable and Comments
- Aggregation Vs Interaction Functions
-
Basic Formula Logic Used in Power BI
DAX formulas for finance reporting.
Hands-on Training
- Learn how to write DAX functions
- Explore the features of Power BI visuals
Topic 02 – Automation of Business Report – Data Preparation & Understanding Data Modeling:
Objective
Learn how to prepare data and build a reliable reporting structure.
- Why data source setup matters and common mistakes to avoid
- Preparing and transforming tables for analysis
- Turning raw data into report-ready data, including text, numbers, and dates
- Core data preparation steps, including the most-used transformations
- Understanding relationships between tables and how tables “talk” to each other
-
Types of relationships, explained simply:
- One-to-One
- One-to-Many
- Many-to-One
- Understanding “lookup” logic and how to bring related data into a table
- Best practices for finance reporting models
-
Learn to connect Power BI with sources mostly used by business and finance professionals:
- Excel and CSV file
- Folders
Hands-on Training
- Step-by-step transformation of a typical finance dataset
- Build a basic data model with examples
Topic 03 – Preparing Budget/Forecast Data & Basic Financial Calculations:
Objective
Prepare Budget/Forecast data and build the foundation for Income Statement reporting.
- Preparing Budget & Forecast data using Power BI data preparation tools
- Assigning correct formats to all columns, including dates, amounts, and categories
-
Connecting key tables in Power BI:
- Actual Trial Balance
- Budget table
- Forecast table
-
Building core Income Statement figures for Actual vs Budget:
- Revenue, Direct Costs, Gross Profit
- Selling & Distribution, General & Admin
- Operating Income, Finance Cost, Other Income/Expense
- Profit Before Tax, Net Profit, EBITDA
-
Presenting the numbers with executive-friendly visuals:
- Actual vs Budget view
- High-level revenue indicators
- Clear formatting, including positive/negative performance highlights
Hands-on Training
- Step-by-step development of data preparation and core financial calculations
Topic 04 – Income Statement Analysis (Monthly, Project-wise & YTD):
Objective
Build Income Statement reporting formats used by finance teams and management.
- Using the right reporting layout, including Table and Matrix visuals, for financial statements
- Creating flexible logic in formulas using “variables” in a business-friendly way
- Using an Income Statement template, from Top Line to Bottom Line mapping
- Handling partial-year actual data correctly, for example, if actuals exist for 7 months, match budget for 7 months
-
Building key comparisons:
- Actual YTD, Budget YTD, Last Year YTD
- Actual vs Budget YTD, Actual vs Last Year YTD
-
Preparing Income Statement formats:
- Monthly Income Statement
- Project-wise Income Statement
- YTD Income Statement
Hands-on Training
- Step-by-step development of multiple Income Statement views
Topic 05 – Income Statement (Current Month & Full Year) with Smart Cut-off Logic:
Objective
Automate Current Month and Full Year reporting based on available actual data.
-
Current Month analysis where numbers update automatically based on the latest available data
- Actual Current Month vs Budget Current Month
- Actual Current Month vs Same Month Last Year
-
Full Year analysis with realistic forecasting logic:
- Actual for posted months + Forecast for remaining months
- Full Year Actual + Forecast vs Budget
- Building “smart logic” inside formulas to automate cut-offs without manual work
-
Advanced KPI Cards for executives:
- Budget variance, including value and %
- Last Year variance, including value and %
- Same Month Last Year variance
- YTD variance
- Clear variance presentation for decision-making
Hands-on Training
- Step-by-step development of Income Statement, including Current Month and Full Year, with automation
Topic 06 – Balance Sheet & Cash Flow Statement Analysis Dashboards:
Objective
Build Balance Sheet and Cash Flow dashboards aligned with finance reporting needs.
-
Calculating Balance Sheet figures:
- Current assets and non-current assets
- Current liabilities and non-current liabilities
- Owners’ equity
-
Building key Balance Sheet ratios:
- Current Ratio / Cash Ratio
- Debt-to-Equity
- Using a Balance Sheet template to structure reporting in Power BI
-
Cash Flow Statement reporting:
- Operating activities
- Investing activities
- Financing activities
- Using a Cash Flow template for structured presentation
Hands-on Training
- Step-by-step development of Balance Sheet Analysis Dashboard
- Step-by-step development of Cash Flow Statement Analysis Dashboard
Topic 07 –Customer Ageing Analysis (Receivables Intelligence):
Objective
Build business-ready customer ageing insights to improve cash flow visibility and receivables management.
-
Customer Ageing Setup
- Integrate Posting Date / Invoice Date
- Calculate invoice ageing dynamically
- Ageing Bucket Classification, such as 0-30 Days
-
Business Usability Enhancements
- Proper sorting of ageing buckets
- Clean and intuitive reporting structure
- Executive-friendly layout for quick decision-making
-
Key Financial Measures
- Accounts Receivable (AR)
- Net Due Amount
- Gross AR Exposure
- Overdue Analysis
-
Insight Generation
- Identification of overdue customers
- Concentration risk analysis
- Early warning signals for collection issues
Hands-on Training
- Step-by-step development of Customer Ageing Dashboard
- Step-by-step development of Dynamic Ageing Groups
- Step-by-step development of Receivable KPIs and actionable insights
Topic 08 – Dynamic Commentary on Profitability Analysis and C-level Executive “CFO Dashboard”:
Objective
Develop management-ready insights on profitability performance using structured ratios and automated commentary for executive decision-making.
-
Profitability Ratio Analysis
- Gross Profit Margin
- EBITDA Margin
- Net Profit Margin
-
Dynamic Executive Commentary AI-Ready
- Automated commentary based on performance thresholds
-
Intelligent labels:
- Good Performer
- Watchlist
- Needs Immediate Attention, CEO Alert
-
Business-focused narratives explaining:
- Growth / decline drivers
- Margin movement insights
- Variance root causes
Hands-on Training
- Profitability ratio dashboards along with dynamic commentary using DAX
- Step-by-step development of Complete CFO Dashboard
Topic 09 – AI-Assisted Financial Analytics using Power BI & Claude MCP:
Objective
Introduce finance professionals to the practical use of Artificial Intelligence in financial data preparation, modeling, and analytics using Power BI. Participants will learn how AI can significantly accelerate development of financial reports and dashboards while improving analytical depth.
-
AI in Financial Data Transformation
Using Claude MCP integration with Power BI to automate data preparation tasks.
- Transform Monthly Trial Balance into analysis-ready dataset
- Unpivot and structure financial data automatically
- Generate Power Query transformation logic using AI prompts
- Improve data cleaning and preparation efficiency
-
AI-Assisted Data Modelling
Using AI to accelerate the development of financial reporting models.
- Generate a comprehensive Date Table using Power Query
- Build relationships between financial tables
- Create structured financial models for reporting
- Understand how AI supports faster model development
-
AI-Assisted Financial Reporting
Using AI to build financial statements faster.
- Create Income Statement measure for Matrix visual
- Build Income Statement with Level-3 drill-down structure
- Design reusable financial reporting templates
- Use AI prompts to generate DAX logic
Hands-on Training
- Step-by-step demonstration of AI-assisted Power BI development
Your Instructors

admin
See more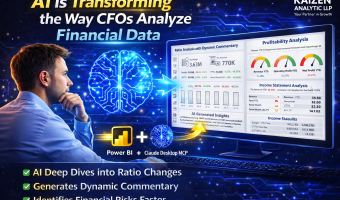
$ 200
Material Includes
- 🎁 What You’ll Get When You Join This Course
- ✅ CFO Dashboard Template Pack (Board-Ready)
- ✅ Fully Structured Financial Datasets
- ✅ AI-Enabled Development Assets
- ✅ Trainer’s Complete Power BI Files (PBIX)
- ✅ Session Recordings (Lifetime Learning Access)
- ✅ Exclusive Bonus – Udemy Course Access